
From this article you will learn:
- How to effectively configure reports in Google Analytics 4.
- How to measure the effectiveness of marketing campaigns in GA4.
- What are the differences between standard and exploratory reports.
- How to use the key reports in this tool.
In the face of dynamic market changes, companies need increasingly sophisticated analytical tools. Google Analytics 4 (GA4) meets these expectations by offering advanced data analysis.
It's a tool that goes beyond the capabilities of the previous Universal Analytics (UA), with which many users have become accustomed. GA4 provides accurate information, supporting better business decisions. In this post you will find the most important information about this system.
Why configure reports in GA4?
Universal Analytics used to offer about 120 pre-built reports, while GA4 has only 20 by default. Google, however, allows users to fully customize reports, tailoring them to individual needs.
Protip
To realize the full potential of GA4, it is necessary to spend time setting up and learning how to use the interface. However, this is an investment that quickly pays dividends.
How to measure the effectiveness of marketing campaigns?
To evaluate the effectiveness of marketing campaigns, it is necessary to analyze the paths of users' interactions with the site, the app or both. In Google Analytics 4, three main dimensions play a key role: first user-source/medium, session-source/medium and source/medium attributed to a specific event.
These three dimensions offer different approaches to assigning traffic sources:
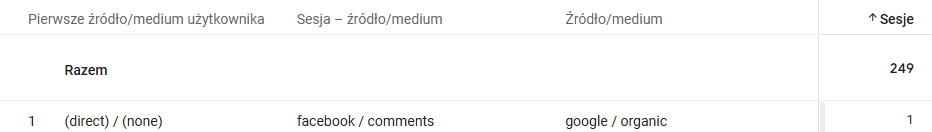
- The first source/medium is attributed at the user level and represents the site that acquired it in the first session. This is an example of first-click attribution.
- The session dimension is based on the last-click attribution model because it is assigned at the session level and represents the source of that particular session.
- The last dimension relates to the source/medium attributed to a specific event, where Google Analytics attributes the conversion share to the sources/media that appeared in the user's path. The whole thing is based on the default attribution model in GA4, which is data-driven attribution.
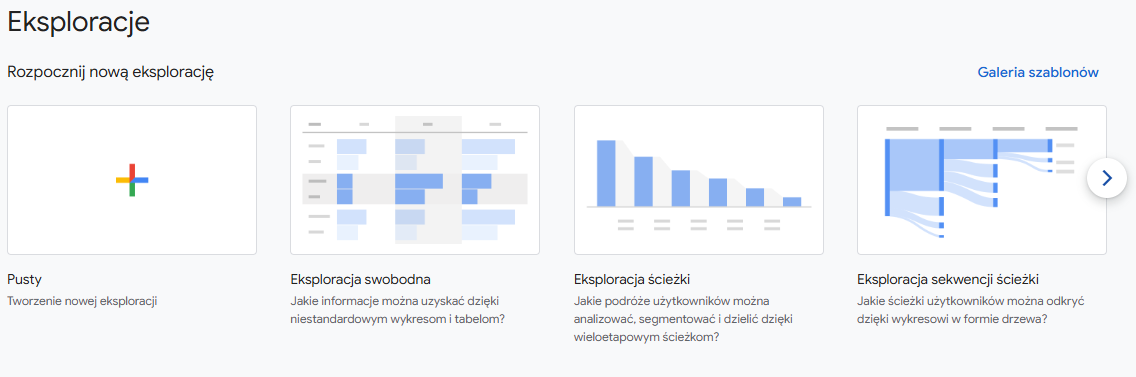
Differences between standard reports and exploratory reports in GA4
Google Analytics 4 offers standard reports that provide quick access to basic data on the performance of a website or application. These reports are easily customizable and can be edited to better suit individual user requirements:
Exploratory reports, on the other hand, allow you to analyze data in more detail. With them, you can create advanced summaries, apply a variety of filters, and select the appropriate dimensions and measures according to your needs. They also allow for various forms of visualization, which increases their usefulness in analysis:
Protip
Exploratory reports are a great tool if you care about answering specific business questions accurately. With the ability to visualize data in an accessible way, you will more easily see patterns and draw valuable conclusions. Their flexibility and transparency make using them not only effective, but also convenient.
How to use key reports in GA4?
In Google Analytics 4, you will find reports that are extremely useful for quickly checking your website traffic data and evaluating the effectiveness of your marketing efforts.
1. all traffic acquisition report
This report is located in the "Acquisition" category, under the "Traffic Acquisition" section. It allows you to see where your site's traffic is coming from, and provides valuable information about the sources of visits.
You can customize this report by selecting the default dimension and data set to be displayed. It is also possible to change or add more dimensions, allowing for more detailed analysis.
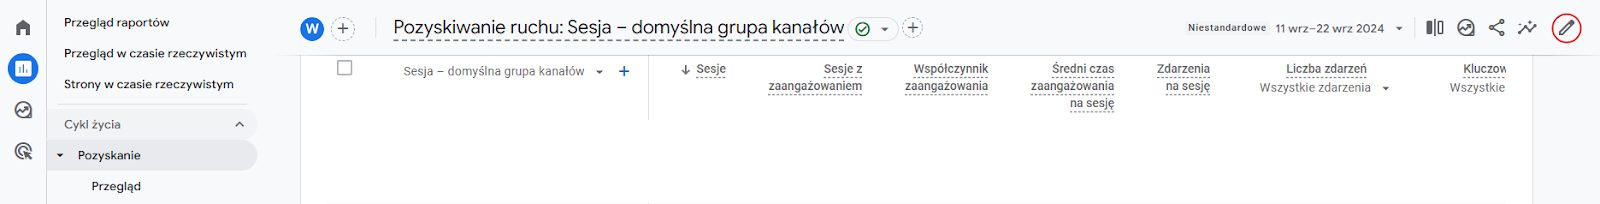

The report allows you to analyze traffic by channel group, source, medium, campaign or source platform. This allows you to easily verify the effectiveness of the activities that attract users to your site. This is a key tool to support the development of any website.
2. e-commerce reports
In Google Analytics 4, you'll find the product sales report under the "Revenue Generation" category in the "E-commerce Purchases" section.
You can modify the report in the same way as for traffic acquisition and other standard reports. The difference is only in the selection of the main dimension in the reports, which can refer to product-level parameters such as product brand, name, identifier, or category.

3. sales reports and purchase path analysis in GA4
In Google Analytics 4 you will find basic sales data. For more detailed transaction information, why not use the reports in the "Explorations" section, which allow you to do advanced analysis and create personalized views of sales data.
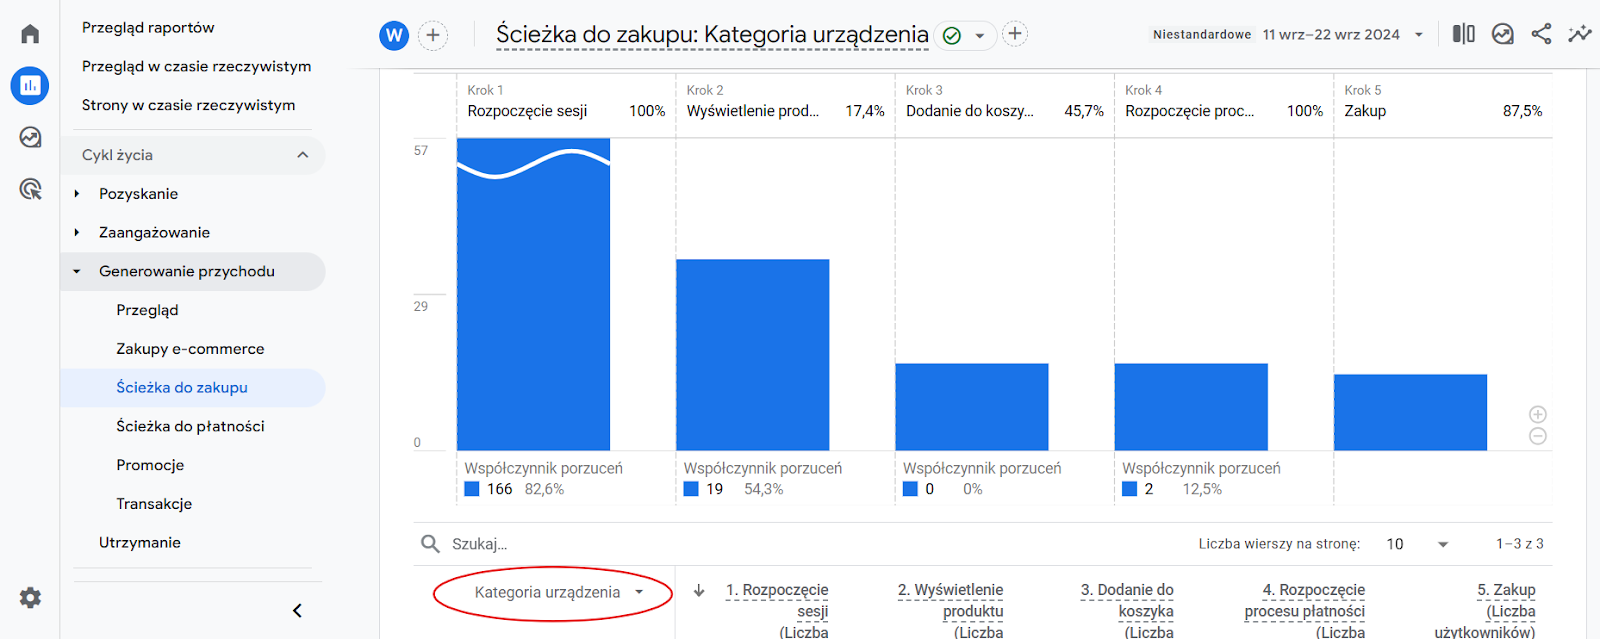
4. path to purchase report
Another standard report that deserves attention is Path to Purchase. It will allow you to quickly verify the flow of users along the path to purchase. In addition, you have the option to split the data into dimensions related to location or technology:
5. conversion path report
Attracting a user to a site may seem relatively simple, but the key question is: how many times does he or she need to visit the site to perform an expected action, such as making a transaction?
It's worth taking a look at the Conversion Paths report, which you'll find in the "Ads" section . This report doesn't allow you to modify it, but it does allow you to filter the data and select the main dimension. You can analyze information based on source, medium, campaign, or channel grouping, which helps you understand what marketing activities are effectively driving users to conversions.
Tips
1. pay attention to data sampling
When analyzing reports in Google Analytics 4, it is worth noting the sampling of data. You can easily identify this with the icon at the top right of the screen.
- A green icon with a checkmark indicates that the report shows full data, without sampling.

- A red triangle with an exclamation mark indicates that sampling or thresholding of data was applied, and some of it may have been moved to the "(other)" line.
A similar situation occurs when the amount of data is too small. In such cases, GA4 applies restrictions to prevent individual users from being identified.
2. use custom channel grouping
Channel grouping in GA4 is a feature that allows you to accurately analyze your traffic by adjusting channel categories to fit your specific marketing efforts. An example would be to create a channel "influencers cat. 1", grouping the top influencers working with the brand.
To correctly assign traffic to the appropriate channels:
- use consistent campaign tagging. With UTM parameters, you can determine which channel the traffic should go to,
- implement the tracking concept in your organization, a structure of UTMs with a uniform naming scheme used by the entire team,
- Consider preparing an internal tag generator to minimize the risk of errors, such as typos in tags.
Create channel groups with care. GA4 allows you to create up to three groups, including the default channel grouping. Once configured, these groups will be visible in standard reports and explorations, making data analysis easier.
3. use custom definitions
Custom definitions allow you to track additional data on your site that is specific to your business or campaign. They allow you to collect and analyze information that is not available in standard Google Analytics 4 reports.
Custom definitions fall into three main categories:
- Custom dimensions - allow you to collect detailed information about users, events or products. For example, you can add a dimension that captures additional user attributes, such as subscription type or account status.
- Custom events - allow you to create special events that are specific to your site, such as button clicks, form interactions or specific user actions.
- Custom Products - allow you to track additional e-commerce product attributes, such as unique product categories or custom attributes that may be relevant for sales analysis.
The benefit of using custom definitions is the flexibility to collect data that meets your individual analytical needs.
4. pay attention to custom data and calculated data in GA4
Another type of definition in GA4 is custom data, which is mainly about events. With these, you can collect data in non-standard units of measurement, such as:
- distance - useful, for example, in analyzing user tracking in mobile applications,
- date - allows recording specific dates related to user interactions,
- Currency - to track transactions in different currencies,
- standard - allows you to track other specific data that is important in the context of events.
Calculated data is another definition in GA4 that allows you to add fields based on the results of calculations. With this, you can easily add metrics such as:
- conversion rate,
- return on advertising spend (ROAS).
It is worth mentioning that the calculated data can also be based on units of measurement. Such calculated fields can be added to reports in the exploration section, allowing advanced data analysis.
The available limit is five calculation fields for standard services and 50 for the 360 version.
Summary:
- Google Analytics 4 (GA4) is an advanced analytics tool that offers flexibility and the ability to accurately analyze data to support better business decisions. The system allows full customization of reports, allowing you to tailor them to your individual needs. It is worth taking the time to configure the tool, as it brings quick benefits.
- GA4 offers three main dimensions for evaluating the effectiveness of marketing campaigns: first user-source/medium, session-source/medium, and source/medium attributed to a specific event.
- Reports in GA4 are divided into standard reports, which provide quick access to data, and exploratory reports, which allow for more detailed analysis and advanced data visualization. These reports help evaluate the effectiveness of marketing and sales activities, such as traffic acquisition, e-commerce, purchase paths and conversions.